One of the most important features of any ETL application or service is the ability to monitor and analyse the performance of the data load. Data Factory comes equipped with robust monitoring solutions. Monitoring options in Data Factory are not only limited to visually monitoring using the UI but can be done programmatically as well.
In a previous post, we have discussed how to use Azure Monitor to monitor Data Factory Pipelines. In this post, let’s have a look monitoring the copy data activity specifically.
As with any other Data Factory activity, Copy Data activity can be monitored using Azure Monitor UI as well.
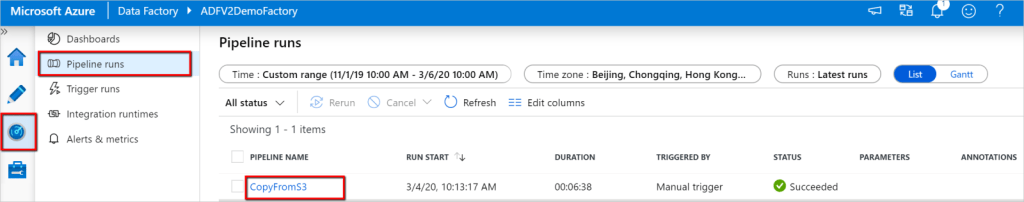
Clicking on the activity name, takes us to the activity monitoring view:
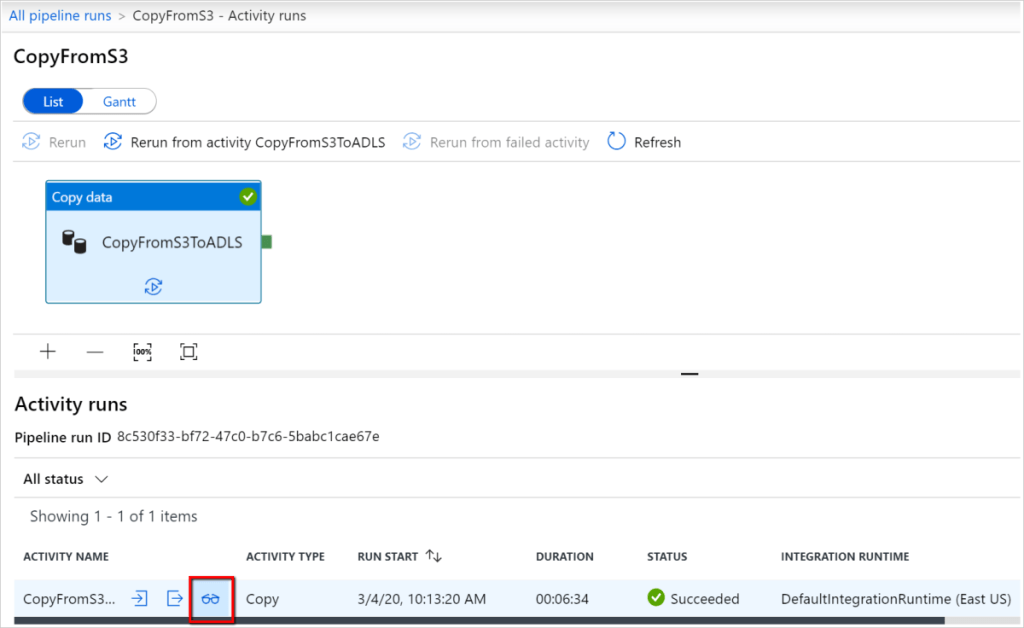
To see further details, we can click on the spectacles logo:
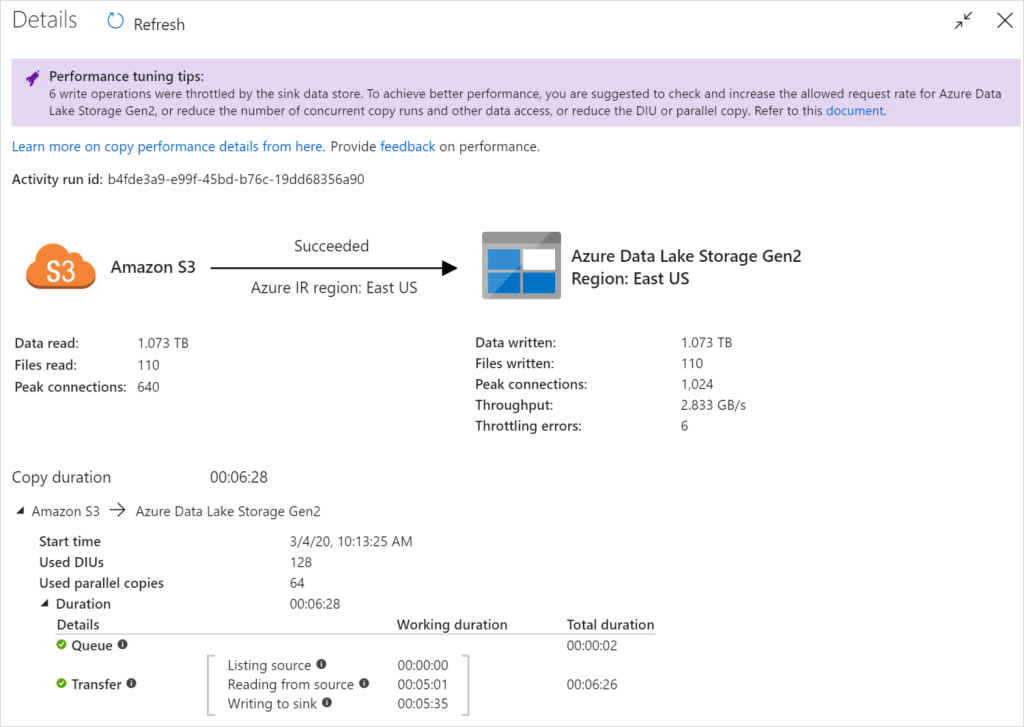
We can see performance related information related to the copy data activity in detail, in this view. The key metrics displayed in this view are the amount of data read from the Source and written to the Sink.
In some scenarios (based on the Pipeline design and performance), Data Factory might even provide some performance tuning tips, as shown in the screenshot above.
There are other details related to the steps during the data transfer, as well as performance counters such as DIUs and no. of parallel copies. These metrics will be discussed in a future post.
Besides visually monitoring, Data Factory also allows Copy Data Activity to be monitored programmatically using SDKs. For further details on programmatically monitoring and a list of all the available Copy Data metrics, please check out the links provided in the Reference section below.
Reference:
2. https://docs.microsoft.com/en-us/azure/data-factory/monitor-programmatically
